We all generate waste, but we can all play a part in minimising how much waste we produce, increasing how much we can recycle, and helping reduce carbon emissions. Council is committed to supporting residents to achieve these goals.
To help our community understand how much waste is generated and how we can work together to reduce, reuse and recycle, we have created an interactive community dashboard. The dashboard allows you to view waste data for both the Local Government Area (LGA) and your suburb.
The dashboard:
- Allows you to see the waste generated in your suburb
- Shows what materials make up your waste
- Indicates how seasonal trends affect the waste that is generated.
How do I use the waste dashboard?
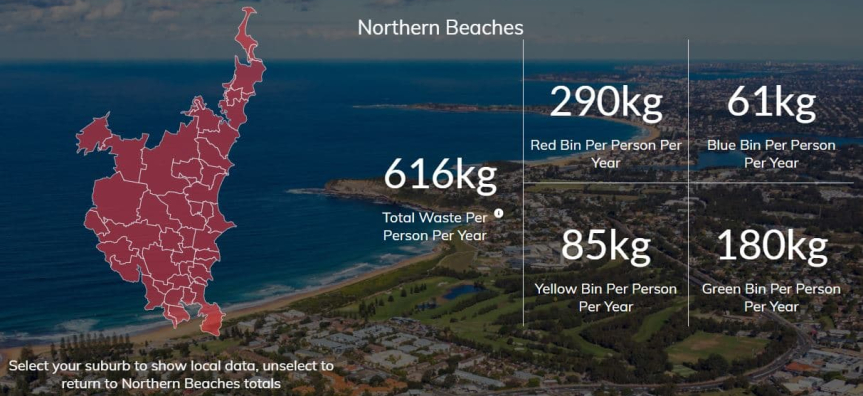
Click on your suburb in the interactive dashboard to see how much waste was generated per person in your suburb, in total and by bin, compared to other suburbs in the LGA. This information is gathered by weighing the contents of the trucks after collecting Northern Beaches waste when they arrive at the waste facilities.
The graph also shows trends over a 12-month period, including by bin type. To change the bin type, select the button at the bottom of the graph.
Click on each bin to find out more about what waste goes in each bin and where your waste goes